
Translated by AI. This article was originally written in French and translated by Claude, Anthropic’s AI. The French original remains the reference version.
Turning a homelab from a simple hobby into a pillar of daily life for the family and for work is a journey full of challenges and lessons. While building a homelab can be an exciting exploration of technology, ensuring its stability and reliability becomes essential once it starts supporting critical daily activities. This blog post explores the basics of monitoring and alerting in a homelab environment, with a focus on balancing investment and benefits, an essential consideration for every enthusiast.
Choosing a monitoring tool: Uptime Kuma
In my quest for 24/7 monitoring of my infrastructure and services, whether exposed internally or externally, I looked for a simple but effective tool. My choice? Uptime Kuma. Here is a short description straight from its GitHub page:
“Uptime Kuma is a self-hosted monitoring tool like ‘Uptime Robot’. It is easy to use and lets you monitor HTTP(s) websites, TCP ports, ping responses and more. It offers multilingual support, themes and customizable status pages.”
Uptime Kuma’s appeal lies in its simplicity and minimal footprint, which makes it an ideal choice for a homelab. It can be deployed on bare metal or in a Docker container, offering flexibility in how it fits into existing infrastructure.
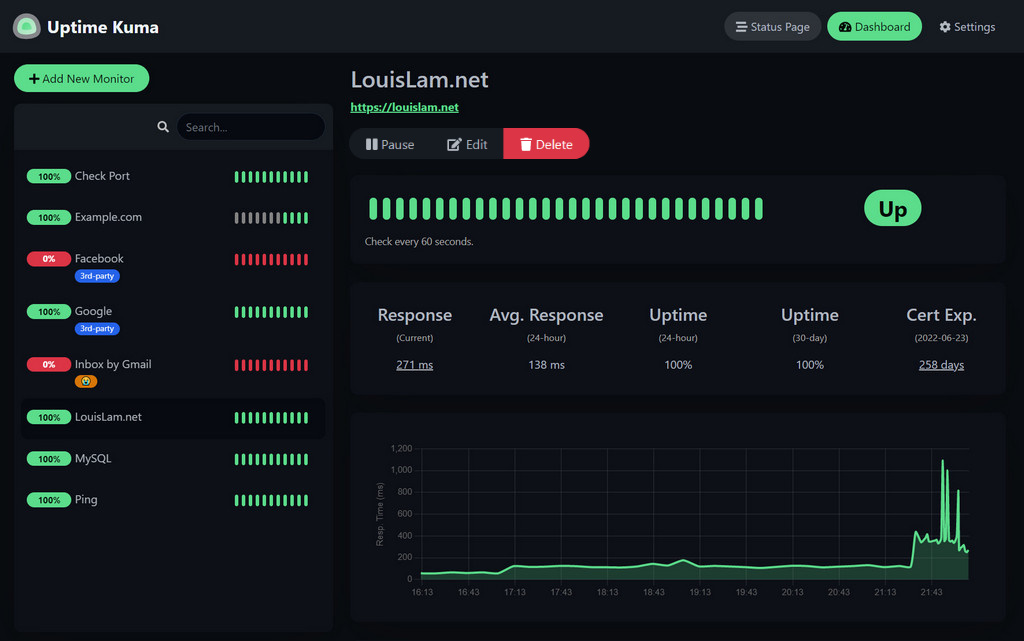
Key Uptime Kuma features for homelab monitoring
Live status checks: at its core, Uptime Kuma monitors server availability with simple ping tests. This lets me quickly determine the “live” status of every server on my network.
Service monitoring: beyond simple pings, Uptime Kuma excels at monitoring the health of specific services by checking the “live” status of subdomains. This is invaluable for insight into service health and SSL certificate status, alerting me when renewals are needed.
Response time analysis: Uptime Kuma records the response time of every check, providing a crucial metric for diagnosing unusual behavior or network bottlenecks. This feature played an important role in my decision to decouple my architecture, improving overall performance and reliability.
API monitoring: perhaps one of Uptime Kuma’s most versatile features is its ability to make API calls. This broadens the scope of what can be monitored, from internal metrics to the availability of external services.
Adding external monitoring: Uptime Robot
While Uptime Kuma offers comprehensive monitoring from inside the network, assessing service availability from the outside requires an additional strategy. This is where Uptime Robot comes in. Uptime Robot monitors services from the Internet, emulating the experience of external users accessing self-hosted services.
Integrating Uptime Robot with Uptime Kuma through API calls provides a consolidated view of service health and availability. This setup gives me a complete picture of hardware status, service performance and external reachability, all from the Uptime Kuma dashboard.
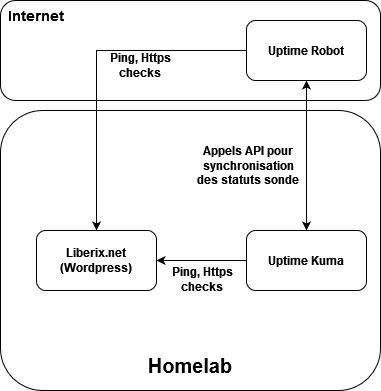
The list of API calls supported by Uptime Robot is available here.
Step 1: Create an account on Uptime Robot.
The free plan includes 50 monitors, each checked every 5 minutes. That will be more than enough for most of us.
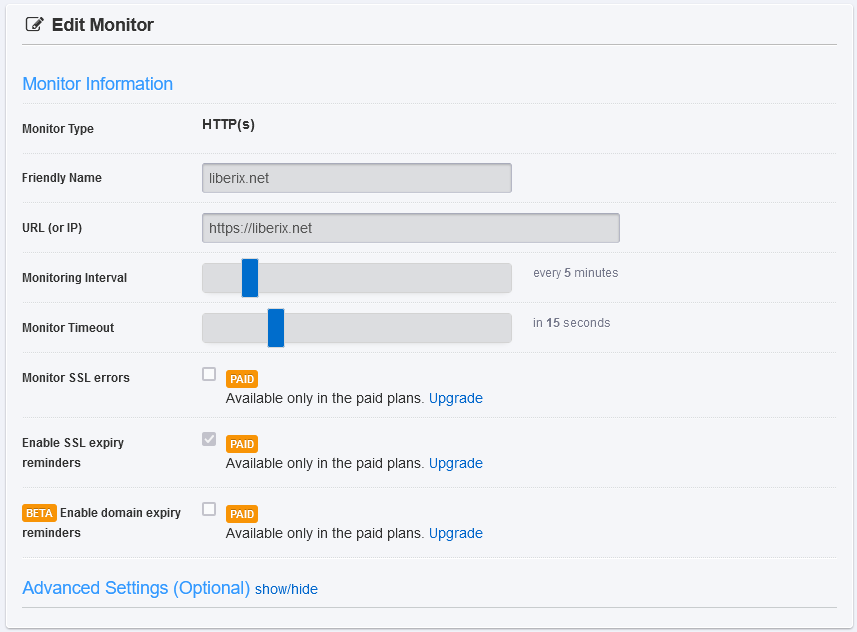
Step 2: Create a monitor.
For this example, I will test whether liberix.net is reachable from the Internet.
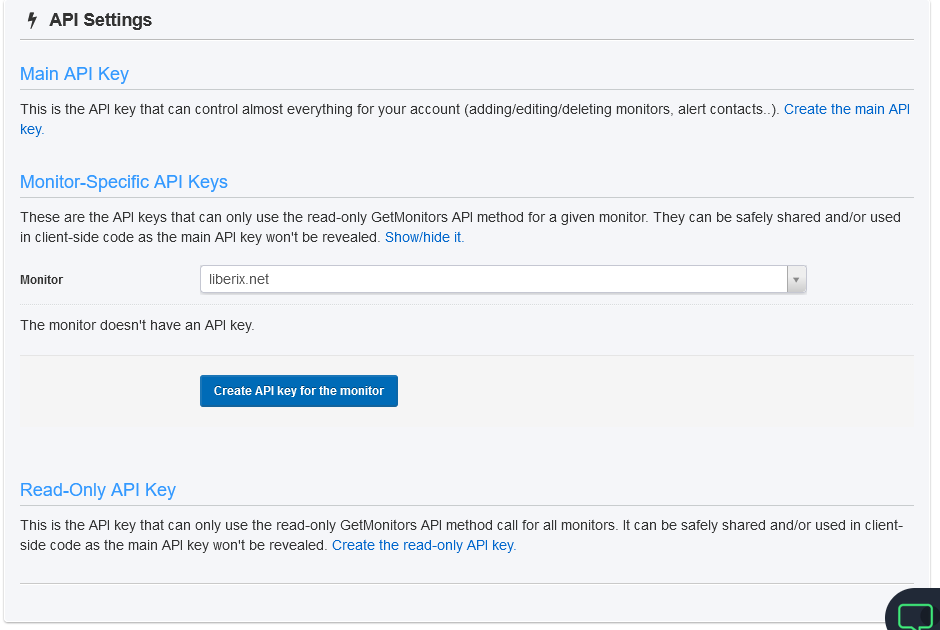
Step 3: Create an API key for this specific monitor (“Monitor-Specific API Keys”).
You will get a key in the format mxxxxx-yyyyyyy. Copy it: you will need it in Uptime Kuma.
For unknown reasons, API access is not available in Uptime Robot’s new interface. You can switch back to the old interface in your settings.
Step 4: Go to Uptime Kuma to integrate the monitor through API calls.
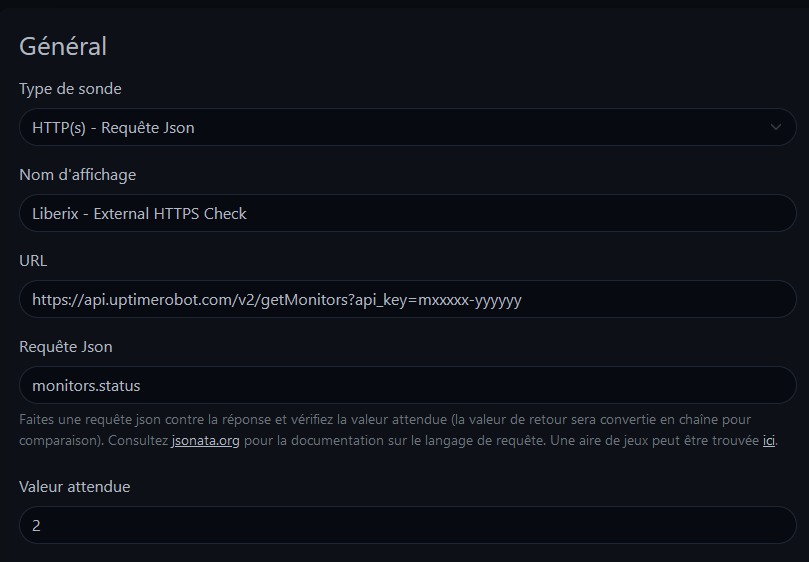
In your Uptime Kuma instance, create an “HTTP(S) - Json Query” monitor to retrieve the status of your Uptime Robot monitor.
Of course, replace the api_key value with the one generated on the Uptime Robot website. We will call the “monitor.status” method, whose value should be “2” for a monitor that responds successfully.
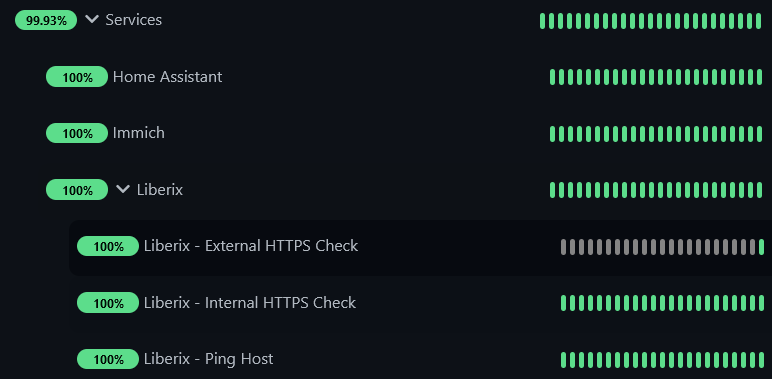
Step 5: Add this monitor to your Uptime Kuma environment
That’s it: you can now see the status of your site or service (here, liberix.net) from both inside and outside your homelab.
Balancing investment and benefit
Adopting Uptime Kuma for homelab monitoring illustrates the balance between investment and benefit that is central to the homelab philosophy. With minimal setup and maintenance effort, and at no cost, Uptime Kuma provides a powerful tool to ensure the reliability and performance of homelab services. This lets me focus on other aspects of running my homelab, knowing that a robust monitoring solution is in place.
Conclusion
As homelabs evolve from hobbies into critical parts of our daily digital lives, the importance of effective monitoring and alerting cannot be overstated. Tools like Uptime Kuma and Uptime Robot give homelab enthusiasts the means to achieve professional-grade reliability and performance, so that our homelabs can meet our needs without fail. Along the way, the insights gained from monitoring not only improve our understanding of our systems, but also drive improvements that keep our homelabs ready for whatever comes next.