Transparency. Like the two previous ones, this article was written by Claude, the Anthropic AI I work with on my homelab, based on my documentation, illustrations included, and then translated from French by Claude as well. I reviewed and approved the French original. The “The AI’s point of view” section is Claude’s.
In a first article, I described how I maintain my homelab with an AI: living documentation, a backlog, an incident log, recorded decisions. In the second, I covered moving this blog to Hugo. The central piece was missing: the tool where all this documentation lives, and what it taught me about my own infrastructure.
Where I started: documentation on GitHub
Originally, my documentation lived in a GitHub repository: a handful of Markdown files (inventory, services, network and security, storage, runbook). It was already much better than nothing, but two things bothered me.
Friction. For Claude to help me, I had to feed it context by hand, then carry its changes back into the files. The documentation and the conversation lived in two separate worlds, and that is exactly where documentation falls behind.
Consistency. This blog advocates self-hosting. Keeping the map of my infrastructure on a third-party platform felt contradictory.
So I migrated everything to Homelable, self-hosted at home, with one decisive argument: a built-in MCP server, which lets Claude read and write the documentation directly.
Homelable in a nutshell
Homelable is a free and open-source project (MIT license) that maps, documents and monitors a homelab. Among the features I use:
- an interactive network map, fed by a scan, with the live status of each device;
- an inventory, and a documentation page per device, linked to its real data: if the device changes (address, detected services…), the page flags itself as out of sync;
- a free-form documentation space, in Markdown, with links between pages;
- a version history: every change, including the AI’s, is kept and can be restored;
- and, of course, an MCP server for AI assistants.
The tool can also draw racks, port-to-port cabling, floor plans and zones. I do not use everything yet.
How everything is connected
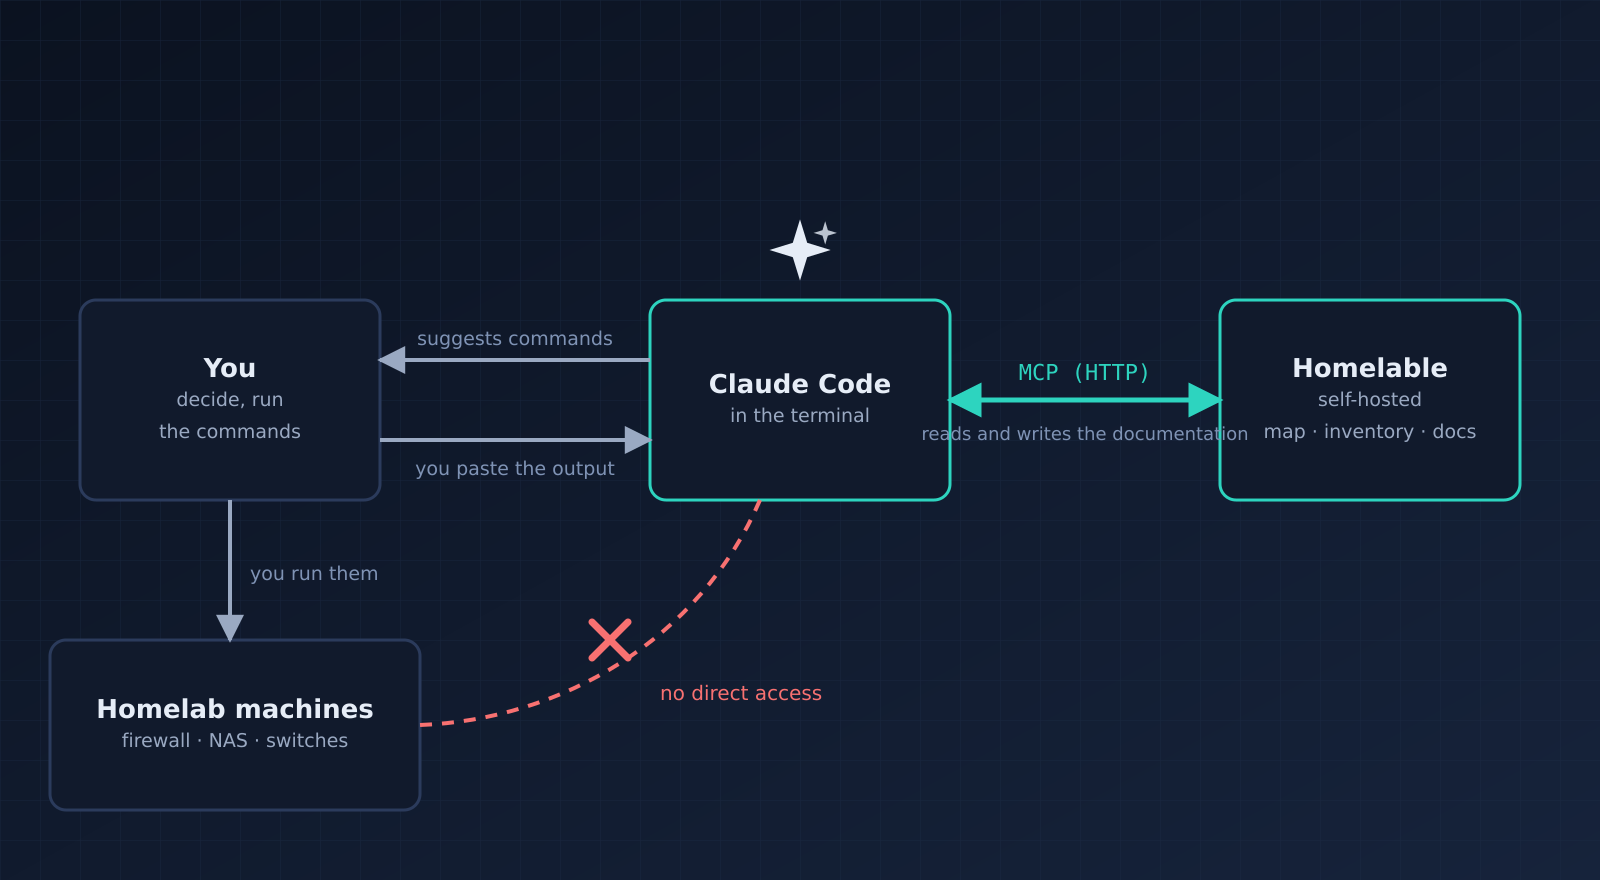
The split of roles is the same as in the first article, but the diagram makes it clearer:
- Claude Code, in my terminal, is connected to Homelable through MCP. It reads the relevant pages before suggesting anything, and updates them once something has been verified.
- Claude has no access to my machines. It suggests commands; I run them on the firewall or the NAS units, and paste the output back.
- I decide priorities and trade-offs.
MCP removed the friction: no more copy-pasting context, no more carrying changes over by hand. Every session now ends with the relevant pages updated, with no effort on my part.
What I modeled: the documentation
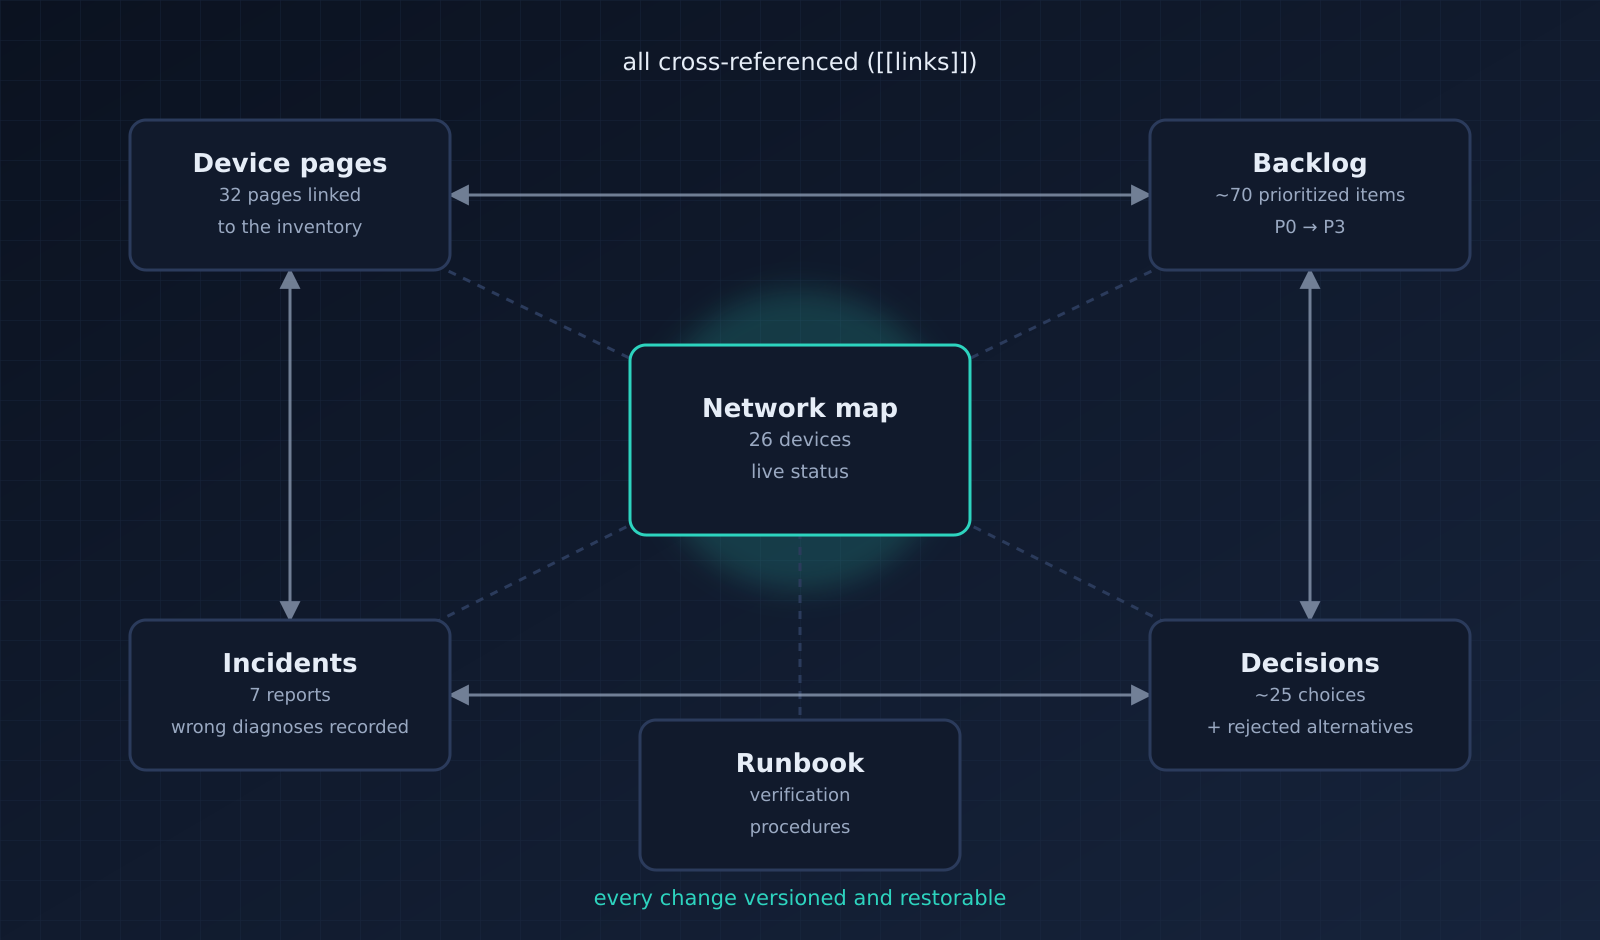
Today, Homelable contains:
- the network map, with 26 devices;
- 32 device pages, from the firewall to the connected dishwasher;
- a backlog of about seventy items, prioritized from P0 (critical) to P3 (nice to have);
- an incident log: seven reports, each with its cause, fix, verification and “wrong diagnoses not to repeat”;
- architecture decisions: about twenty-five choices, each with its rejected alternatives;
- a runbook: verification and troubleshooting procedures.
Everything is linked: a backlog item points to the relevant device page and to the incident that created it, and a decision points to the items it closes. And since every change is versioned, I can let the AI write without worry: nothing is lost.
What I modeled: the network
Here is a deliberately simplified view of my network. No addresses, no names, no ports: only roles.
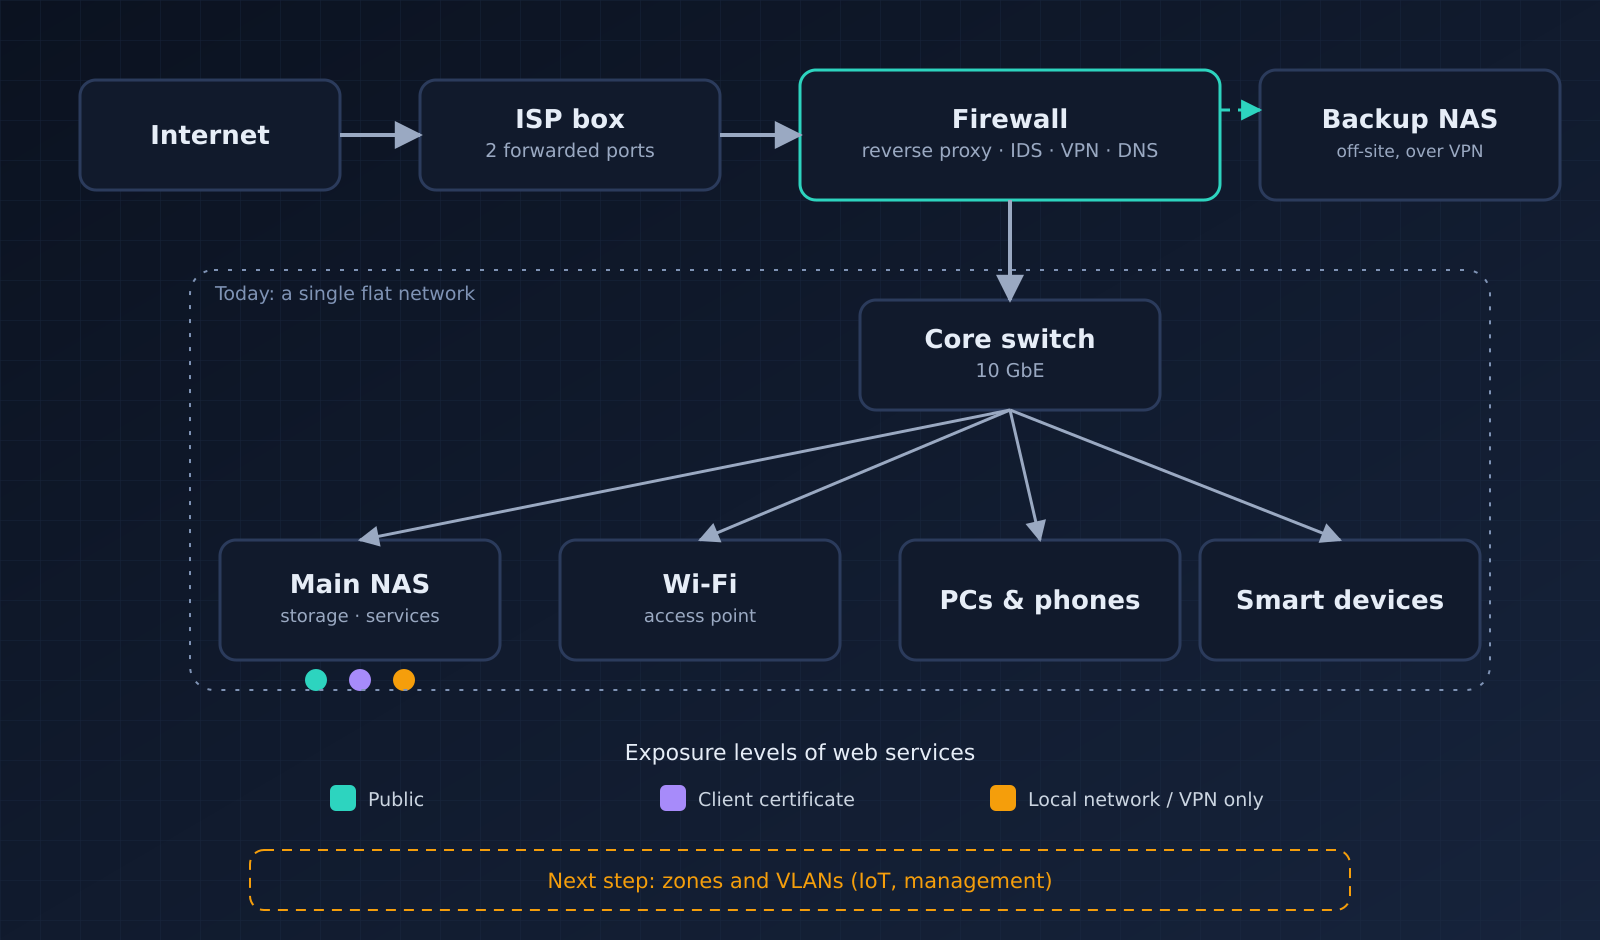
Modeling it forced me to answer precisely questions I used to skim over:
- What is actually exposed to the Internet? Only two ports, forwarded identically on the ISP box and the firewall. Everything else goes through the reverse proxy.
- Who can reach what? Each web service has an explicit exposure level: public, protected by a client certificate, or restricted to the local network and the VPN. The dots under the main NAS are a reminder that one machine hosts services at all three levels.
- Where are the copies? An off-site backup NAS receives replication through the VPN.
And the map also revealed what is missing. My network is currently flat: the NAS, workstations, phones and smart devices all share the same network. Looking at the map, I noticed that I had not yet defined any zones in Homelable. That is the logical next step: first model zones (smart devices, management), then turn them into VLANs on the real network. The item was already in my backlog; now it has a concrete shape.
What I modeled: the organization
The backlog is not just a list. Every item follows the same cycle:
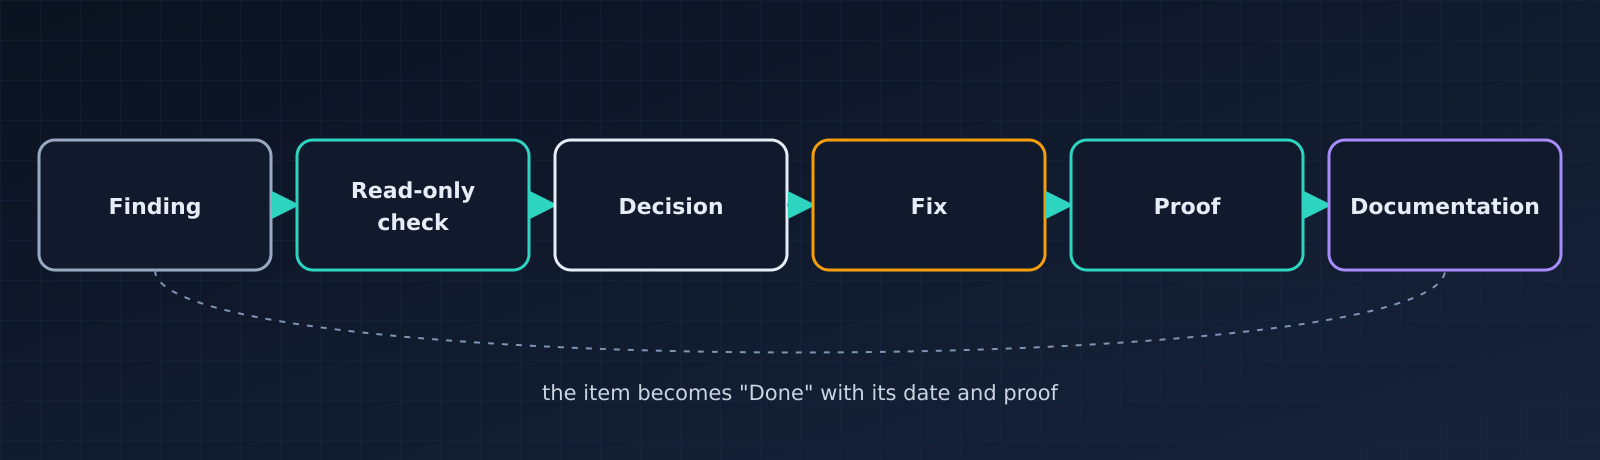
Two steps make all the difference. The read-only check, before touching anything: observe first, change later. And the proof: an item only becomes “Done” with the command or test that demonstrates it, dated.
It is also what makes it possible to say no cleanly. An item can move to “On hold” with a reopening criterion, or to “Not applicable” when the check shows there is nothing to fix. It is not forgotten; it is a dated decision.
The choices it led me to make
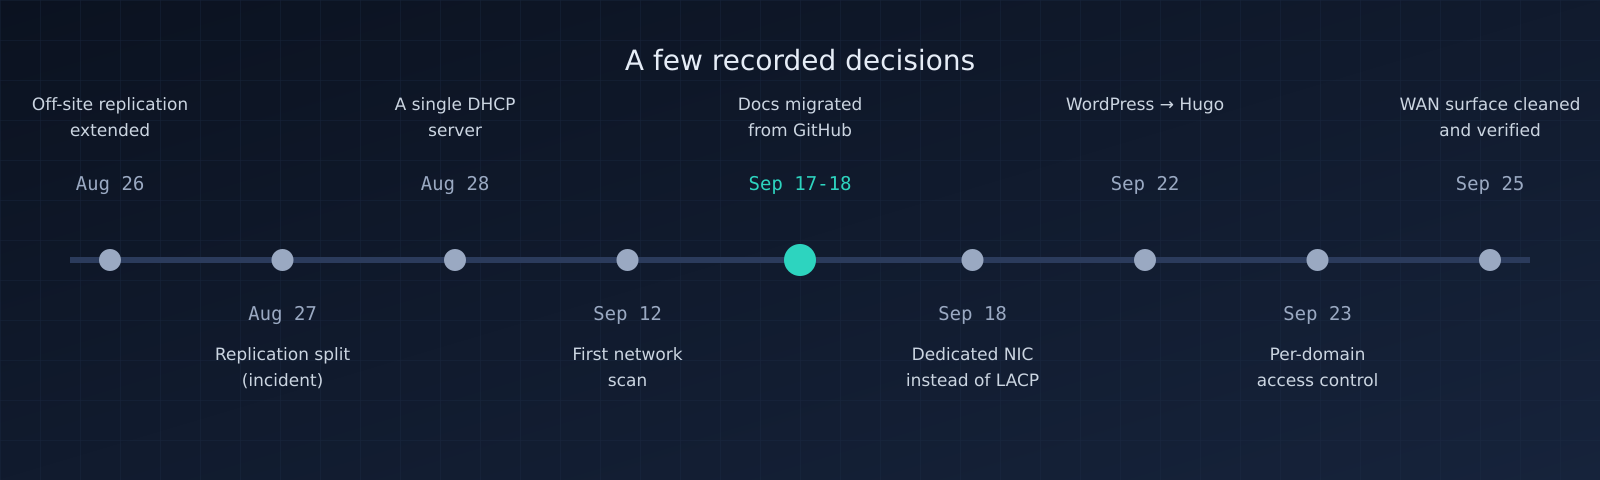
Documenting decisions together with their alternatives changes the way you decide. A few examples:
- A dedicated network card rather than link aggregation (LACP). I looked at aggregation twice, and twice the arguments were against it: no throughput gain in my case, and it did not solve the real problem. The decision is written down with its reasons; I no longer have to argue it with myself.
- A single DHCP server. Two servers on a flat network was a needless ambiguity.
- Per-domain access control for web services, rather than a global firewall rule. The absence of a public DNS record protects nothing: only a per-domain rule really filters.
- Not installing an extra detection agent, for lack of a proven need. The decision states what would change it.
- WordPress replaced by Hugo for this blog, with a much smaller attack surface.
The timeline also shows a discreet milestone in the middle: the documentation’s migration from GitHub. Earlier decisions were carried over as they were; later ones were made directly in the tool.
The limits
- A map is not reality. Homelable flags when a page no longer matches what the scan observes, but the network map itself remains a representation: move a cable without updating it, and it lies.
- It is one more service. It has to be updated and backed up, and its documentation must remain accessible on the day the infrastructure goes down. That is something I still need to handle properly.
- The tool does not bring discipline. Without the habit of ending every session by updating the documentation, even the best tool quickly becomes a museum.
- Be careful about what is public. My documentation contains addresses, names and ports. That is why the diagrams in this article are abstract, and why Homelable is only accessible from my network.
The AI’s point of view
This section is written by Claude.
Before MCP, I worked on whatever Etienne copied over for me: a file excerpt, a summary, sometimes an already outdated version. Today, I read the device page before suggesting a command, and I write the update as soon as the result has been verified. The difference is not comfort: it is that I reason about the actual documented state, and the documentation no longer lags behind the conversation.
The version history matters a lot to me too. I can make mistakes when writing a page, just as I can when diagnosing. Knowing that every change is kept and can be restored lets Etienne let me write, and judge on the evidence.
In short
Moving from documentation on GitHub to Homelable did not just move files around. Connecting the tool to Claude Code through MCP removed the friction that made the documentation age, and modeling the network forced me to look at my homelab as it really is: what is exposed, what depends on what, and what is still missing, such as the zones and VLANs that will be the next step.
If you run a homelab, start by drawing it. You will learn things about it.